Why this Bull Run might be a Bad Omen?
In my previous discussion, I highlighted the long-term performance of the equal-weighted S&P 500 ETF (RSP) in comparison to the S&P 500 ETF. Over a period of 20 years, RSP has outperformed its counterpart in most years. This achievement is attributed to the size factor, which indicates that smaller companies tend to yield greater returns than larger ones.
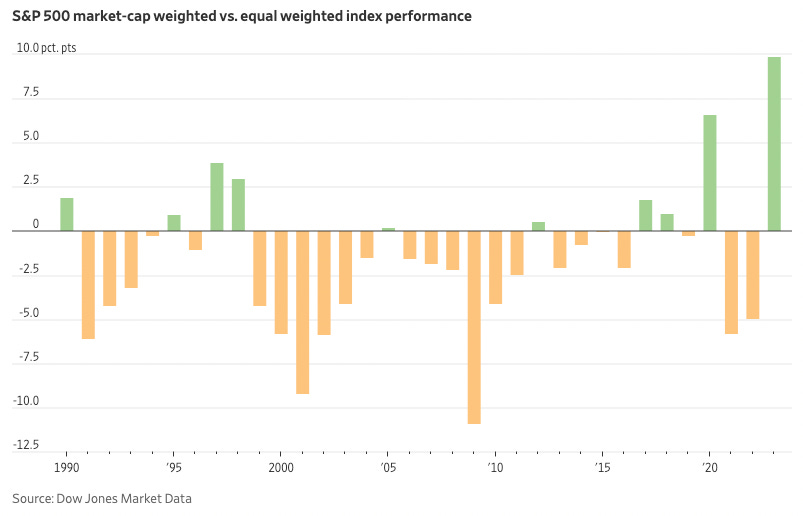
However, this year has been truly exceptional. The S&P 500 Index has achieved a remarkable level of outperformance, surpassing its equal-weighted counterpart by nearly 10 percentage points. This significant margin of outperformance in 2023 is the largest on record so far, as reported in a recent article by WSJ. The visual representation of this comparison can be observed through the green bars, indicating the S&P 500's outperformance, while the orange bars depict the outperformance of the S&P 500 equal-weighted index.
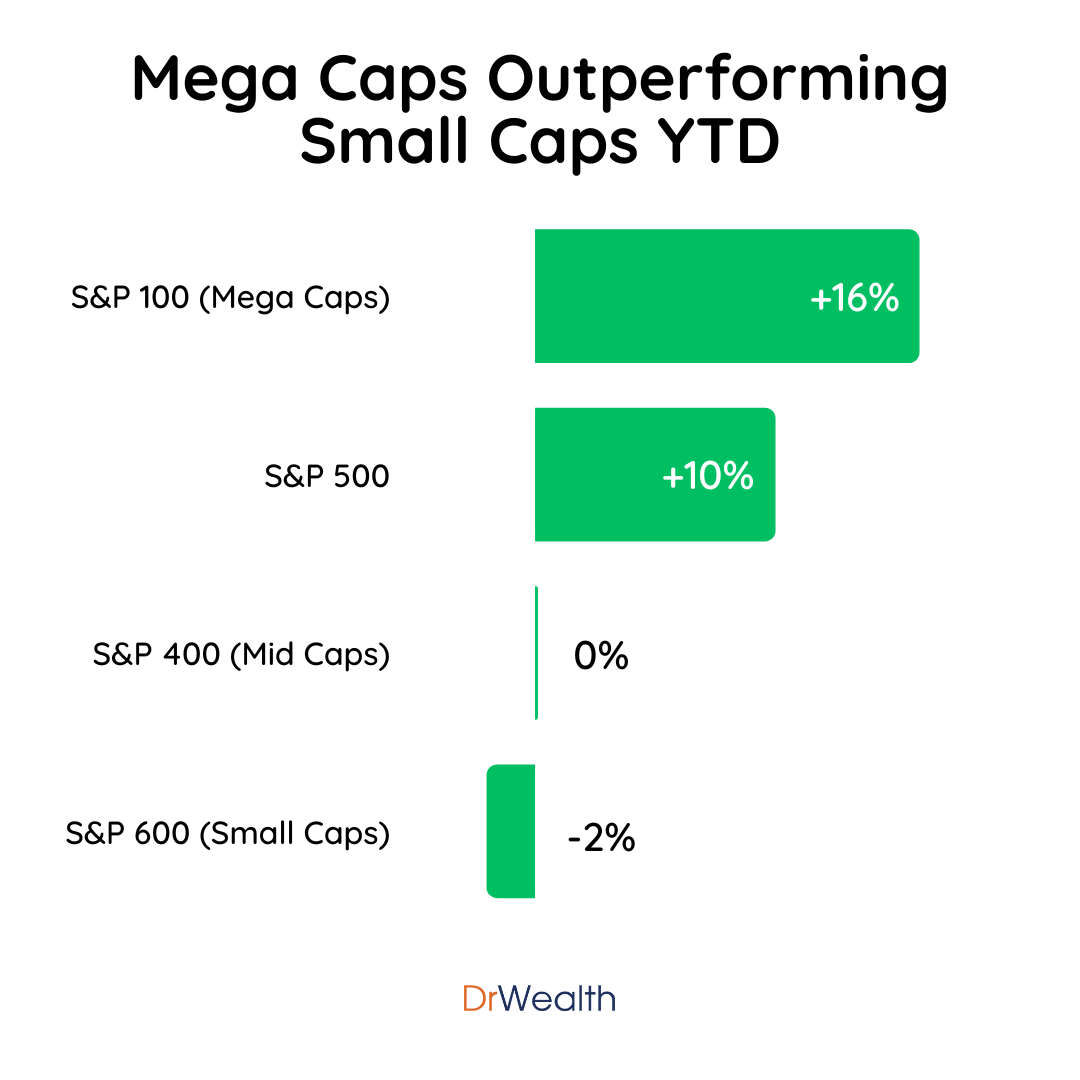
This pattern of underperformance extends beyond the S&P 500 when comparing returns against small companies outside the index. For instance, the S&P 400 ETF (SPMD), representing mid-cap stocks, remained flat, and the S&P 600 (SLY), representing small-cap stocks, declined by 2%, while the S&P 500 gained 10% year-to-date.
The contrast in performances becomes even more apparent when considering the 100 largest stocks in the S&P 500, tracked by the S&P 100 ETF (OEF), which saw a 16% increase. This highlights that mega cap companies are primarily responsible for driving up the indices and the overall market, rather than a broad-based recovery.
Delving deeper into the performance of individual S&P 500 components, the largest 250 stocks yielded an average return of 2% year-to-date, while the smallest 250 stocks recorded an average decline of -4% during the same period.


